Research article
Scatter-search with support vector machine for prediction of relative solvent accessibility
Amir Hosein Kashefi1, Alireza Meshkin2[*], Mina Zargoosh2, Javad Zahiri3, Mohsen Taheri2, Saman Ashtiani3
1Young researchers Club, South Tehran Branch, Islamic Azad University, Tehran, Iran2Department of Computer Engineering, Islamic Azad University, Damavand Branch, Damavand, Iran
3Department of Bioinformatics, Institute of Biochemistry and Biophysics, University of Tehran
EXCLI J 2013;12:Doc52
Abstract
Proteins have vital roles in the living cells. The protein function is almost completely dependent on protein structure. The prediction of relative solvent accessibility gives helpful information for the prediction of tertiary structure of a protein. In recent years several relative solvent accessibility (RSA) prediction methods including those that generate real values and those that predict discrete states have been developed. The proposed method consists of two main steps: the first one, provided subset selection of quantitative features based on selected qualitative features and the second, dedicated to train a model with selected quantitative features for RSA prediction. The results show that the proposed method has an improvement in average prediction accuracy and training time. The proposed method can dig out all the valuable knowledge about which physicochemical features of amino acids are deemed more important in prediction of RSA without human supervision, which is of great importance for biologists and their future researches.
Keywords: physicochemical properties of amino acids, evolutionary information, PSI-BLAST, feature selection methods, support vector regression
Introduction
Predicting the relative solvent accessibility (RSA) of a protein is an important step for determining its native structure and thus its function (Lee and Richards, 1971[18]).
Even without proper understanding of the protein folding mechanism, useful insights on possible 3D conformations of a target protein can be obtained from its predicted solvent accessibility during the process of protein structure modeling (Joo et al., 2007[15]; Xu et al., 2009[33]; Wang et al., 2010[31]) including, for example, quality assessment of protein models (for finding the near-native structures) (Benkert et al., 2009[4]; Cheng et al., 2009[5]), and detection as well as threading of remote homologous proteins in template based modeling (Peng and Xu, 2010[23]) sequence profile; machine learning.
Due to the immense time and economic costs of experimental methods in determining protein structure, predicting tertiary structure of proteins have great importance. Despite several decades of extensive researches in tertiary structure prediction, this task is still a big challenge, especially for sequences that do not have a significant sequence similarity with known structures (Ginalski and Rychlewski, 2003[12]). Thus, the simplification of the problem, reducing 3D structure to 1D features, may be useful and regarded as the first-step in understanding the protein-folding problem. The prediction of secondary structures is the most familiar and well-defined aspect of the problem (Jones, 1999[14]). The prediction of solvent accessibility is another aspect of the problem (Garg et al., 2005[9]).
The existing solvent accessibility prediction methods use the protein sequence, which is converted into a fixed-size feature-based representation, as an input to predict the RSA of each residue. These methods can be divided into two main groups:
- Real valued predictors that predict RSA value. The representative existing methods are based on linear regression (Wagner et al., 2005[29]), neural network based regression (Adamczak et al., 2004[1]), neural networks (Shandar et al., 2003[25]), support vector regression (Yuan and Huang, 2004[37]; Xu et al., 2005[34]; Meshkin and Ghafuri, 2010[19]), pace regression (Meshkin and Sadeghi, 2009[20]), and look up table (Wang et al., 2004[30]). In the study of Shandar et al. (2003[25]), binary coding of the sequence was taken as the input features, while all other studies use the evolutionary information in the form of the PSSM profile derived with PSI-BLAST as the input features (Wagner et al., 2005[29]; Adamczak et al., 2004[1]; Yuan and Huang, 2004[37]; Xu et al., 2005[34]; Wang et al., 2004[30]).
- Discrete valued predictors classify each residue into a predefined set class. The classes are usually defined based on a threshold and include buried, intermediate, and exposed classes (in most cases the predictions concern only two classes, i.e., buried vs. exposed). The corresponding prediction methods apply fuzzy-nearest neighbor (Sim et al., 2005[27]), neural network (Cuff and Barton, 2000[7]; Shandar and Gromiha, 2002[24]; Gianese and Pascarella, 2006[10]), support vector machine (Meshkin and Ghafuri, 2010[19]; Kim and Park, 2004[17]; Yuan et al., 2002[36]), two stage support vector machine (Nguyen and Rajapakse, 2005[22]), information theory (Naderi-Manesh and Sadeghi, 2001[21]), and probability profile (Gianese et al., 2003[10]). Early studies only used sequence to generate features (Shandar and Gromiha, 2002[24]; Naderi-Manesh and Sadeghi, 2001[21]), while recent studies have used the evolutionary information in the form of the PSSM profile to generate features (Kim and Park, 2004[17]; Nguyen and Rajapakse, 2005[22]). The PSI-BLAST profile (Altschul et al., 1997[2]), was applied as an efficient sequence representation that improves classification accuracy (Cuff and Barton, 2000[7]).
Since, it is believed that the 3D-structure of most proteins is defined by their sequences (Anfinsen, 1973[3]), utilizing data mining methods to extract hidden knowledge and information from protein sequences, is unavoidable. Due to the immense time costs of data mining on large training data, the necessity of investigation in feature selection seems to be essential.
This paper investigates whether improved sequence representation, which is based on the custom selected features harvested from evolutionary information, could lead to improving the RSA predictions. We also investigate whether it would be possible to disclose all the valuable knowledge about which qualitative features are highly correlated with the solvent accessibility of proteins without human supervision. In prediction of protein solvent accessibility with evolutionary information, the dimensions of features are high, i.e. N*20, where N is the size of the window. The idea of this paper is based on the hypothesis that if we use data mining feature selection methods for selecting subset of best-performing features, then prediction accuracy would be improved. This idea results in a simplified prediction model, reduced computational time, and optimized prediction quality. The goals of this paper are achieved by designing a method that operates in two steps.
In the first “feature selection” step, a relatively small subset of evolutionary information is identified on the basis of selected physicochemical properties in each position of the given window. Then in the second step, support vector regression (SVR) is used for building an appropriate model with selected subset of evolutionary features to real value prediction of RSA.
Results and Discussion
The SVR and Scatter Search methods were implemented in Weka, which is a comprehensive open-source library of machine learning methods (Witten and Frank, 2005[32]).
The evaluation was performed using 5 fold cross validation test type to allow for a comprehensive comparison with previous studies.
Residues were classified into two states (buried/exposed). Seven thresholds of 5, 10, 20, 25, 30, 40 and 50 % are tried in the two-state classification. The prediction accuracy was evaluated by the percentage of correctly predicted residues divided by the total number of residues in the test dataset. For example, for the two states we have
where Q% is the percentage of correctly predicted residues, NB and NE represent the number of residues correctly predicted as buried and exposed, respectively.
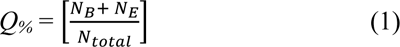
Figure 1(Fig. 1) shows the actual and predicted values for residues in thioredoxin (PDB code: 1ABA). We selected this protein as an example, because residues fall within different ranges of RSA values which are indicative of the high degree of accuracy of this prediction across a wide range of RSAs and residues. It shows good linear relationship between the actual and predicted values.
Comparison with other methods
Since the training model in our method is done in one-step, our method should be compared with methods that their training is done in one-step.
Table 1(Tab. 1) shows the comparison between the results of this work and one stage methods for RSA prediction, including neural network and support vector regression models (Garg et al., 2005[9]; Adamczak et al., 2004[1]; Shandar et al., 2003[25]; Xu et al., 2005[34]; Meshkin and Sadeghi, 2009[20]; Shandar and Gromiha, 2002[24]; Gianese et al., 2003[10]).
Since these methods predict discrete valued classes (exposed vs. buried), we examined the performance of our method by converting the real value prediction into the two states prediction. We followed the standard approach, in which the state is defined based on the predicted RSA value and a predefined threshold. For instance, a 5 % threshold means that the residues having an RSA value (%) greater or equal 5 are defined as exposed, and otherwise they are classified as buried. The threshold's value is usually adjusted between 5 % and 50 %, see Table 4. Best values are shown in the bold face.
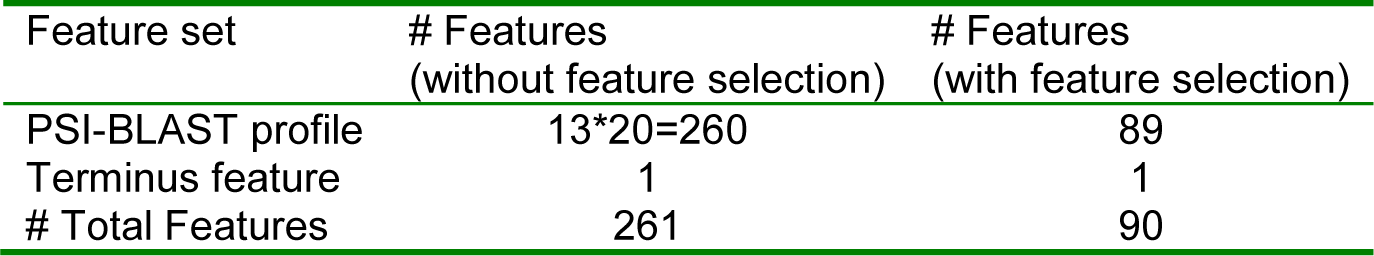
The two main remarks based on the performed experimental evaluation are the favorable error rates obtained by proposed method when compared with seven competing methods; and the reduced number of features (i.e. 89+1 attributes instead of 13*20+1 attributes) results in a simplified prediction model that reduce computational time, and optimized prediction quality.
Conclusions
In this paper, an approach for predicting protein relative solvent accessibility has been presented, which relies on two-step procedure, consisting of a subset selection of evolutionary information, followed by a real-value predictor of relative solvent accessibility.
As shown in our experiments, many of features in evolutionary information do not have any significant impact on prediction of RSA for a central residue in a given window. Despite of choosing subset of features, prediction accuracy has not decreased, and in some thresholds, prediction accuracy has improved in comparison with methods that their training is done in one step and using all features of evolutionary information.
The advantage of this work is that we do not apply biological knowledge in selection of qualitative features that have strong relationship with protein solvent accessibility, but instead we use mathematically-based feature selection method to find out which features are highly correlated with the solvent accessibility of proteins. Interestingly, the results of feature selection method adopt with biologically concepts about the relation between physicochemical properties of amino acid and protein solvent accessibility.
Materials and Method
In this section, the definition of relative solvent accessibility, dataset, qualitative features and quantitative features are introduced. Then, the proposed two stage method is described.
Relative solvent accessibility
RSA reflects the percentage of the surface area of a given residue that is accessible to the solvent. RSA value, which is normalized to (0, 1) interval, is calculated by dividing the accessible surface area from DSSP (Kabsch and Sander, 1983[16]), by the maximum solvent accessibility according to Chothia's work (1976[6]), which uses Gly-X-Gly extended tripeptides that there are shown in Table 2(Tab. 2) in units of Å.
Dataset
The set of 215 nonhomologous protein chains with no more than 25 % pairwise-sequence identity used in the experiment of Manesh dataset (Naderi-Manesh and Sadeghi, 2001[21]). The sequences are available online at http://gibk21.bse.kyutech.ac.jp/rvp-net/all-data.tar.gz. The Manesh dataset has been widely used by researchers to benchmark prediction methods (Garg et al., 2005[9]; Shandar et al., 2003[25]; Xu et al., 2005[34]; Meshkin and Ghafuri, 2010[19]; Meshkin and Sadeghi, 2009[20]; Wang et al., 2004[30]; Shandar and Gromiha, 2002[25]; Gianese et al., 2003[10]), and this motivated us to use it to design and validate our method.
Quantitative features
PSI-BLAST is used to compare different protein sequences to find similar sequences and to discover evolutionary relationships (Altschul et al., 1997[2]). PSI-BLAST generates a profile representing a set of similar protein sequences in the form of a 20×N position-specific scoring matrix, where N is the length of the sequence and each position in the sequence is described by 20 features. Since the profile features created by sequence alignment and quantitative criterions, we called them quantitative features. We used PSI-BLAST with the default parameters and the BLOSUM62 substitution matrix in this work.
Qualitative features
We utilized 48 qualitative physicochemical features describing side chain structure and functional groups of amino acid. The complete list of these properties and also how the amino acids described based on these qualitative properties are shown in Figure 2(Fig. 2) (Yu, 2001[35]). In order to be included as a physicochemical property, a property should be characterized (or at least well-estimated) by theoretical analysis of the amino acid structures. For example, which reactions an amino acid participates in or a comparison of the entropy of formation of the amino acids are not properties we can predict well simply by looking at the amino acid structures, but we can characterize the hydrophobicity of an amino acid by looking at properties of its side chain such as what functional groups it has (Yu, 2001[35]).
A bipolar vector is used to represent qualitative features for a window surrounding the given amino acid. Bipolar code set to 1 if amino acids have a specific qualitative feature; otherwise it set to -1.
There are 13*48 features for a 13 residues wide window centered on a target residue in a bipolar vector with format (2). In addition, we added real value of RSA for a centered residue in the given window as a class feature.

For instance, qualitative features for a window surrounding the given amino acid are encoded as (3).

In the first step of our proposed method, qualitative features vectors were used by feature selection method to disclose which qualitative features have most significant relationship with the solvent accessibility of proteins.
Prediction method
From a logical standpoint, the proposed method can be divided to two main steps. The first one, provide subset selection of quantitative features based on selected qualitative features and the second, dedicated to build model for prediction.
Figure 3(Fig. 3) shows a detailed overview of the prediction procedure that consists of two steps. The first is aimed for creating custom selected feature set and the second is responsible for model building.
The proposed two-stage prediction model works as follows:
The task of the first step is grouped into two subtasks: “Qualitative Feature selection” and “Quantitative Feature selection”. In “Qualitative Feature selection” subtask, we want to disclose which physicochemical properties of residues deemed more significant for prediction of RSA with respect to the position of them in a given window. So for this purpose, we create 48*13 (13 is the size of the window) features for each residue in a sequence by considering its neighboring in a given window. After that, we use a data mining feature selection method to find more important features.
Whenever, the subset of qualitative features is found, in “Quantitative Feature selection” subtask, amino acids that have those selected qualitative properties are chosen in each position of window. Finally, we have a subset of best-performing features from PSI-BLAST profile, which are used in the next step for training the model. The sufficient details of feature selection are completely described at subsection 3.1.
The second step is responsible for building model. This step performs core ability and explores unknown relationships between selected PSSM features and RSA by learning from training data. It creates model for RSA prediction of protein sequences. Support vector regression with RBF kernel applies in this step. The SVR is trained using sequential minimal optimization algorithm (Smola and Scholkopf, 1998[28]), which was further optimized by Shevade and colleagues (1999[26]).
Feature selection
Some conformational structures are mainly determined by local interactions between near residues, whereas others are due to distant interactions in the same protein. Therefore, with reducing number of feature in each position of window, we can enlarge the window size and then the effects of more neighbors can be considered for better prediction of RSA values. In addition, reducing dimensionality and removing irrelevant data has further advantages such as reducing the costs of data acquisition, better understanding of the prediction model, and a decrease in training time.
The knowledge that we reveal in the first step of our method is about which of qualitative features of amino acids have the most significant impact on the RSA prediction of the central amino acid in each position of a given window.
With regard to the too high number of PSI-BLAST profile features (in a window with size N), the main practical aim of the first step of our method is to find a smaller subset of features among a set of N*20 features which enables an efficient prediction of relative solvent accessibility of proteins.
Data mining feature selection method are used to find out which physiochemical features of amino acids are most important for predicting relative solvent accessibility. We applies the Scatter Search method (Garcia-Lopez et al., 2006[8]), with forward direction and use CfsSubsetEval method (Hall, 1998[13]), to evaluate the worth of a subset of attributes by considering the individual predictive ability of each feature along with the degree of redundancy between them. Subsets of features that are highly correlated with the RSA values while having low intercorrelation are preferred. Scatter Search is a recent meta heuristic and it has been successfully applied to solve standard problems in three central paradigms of Machine Learning including Clustering, Classification and Feature Selection.
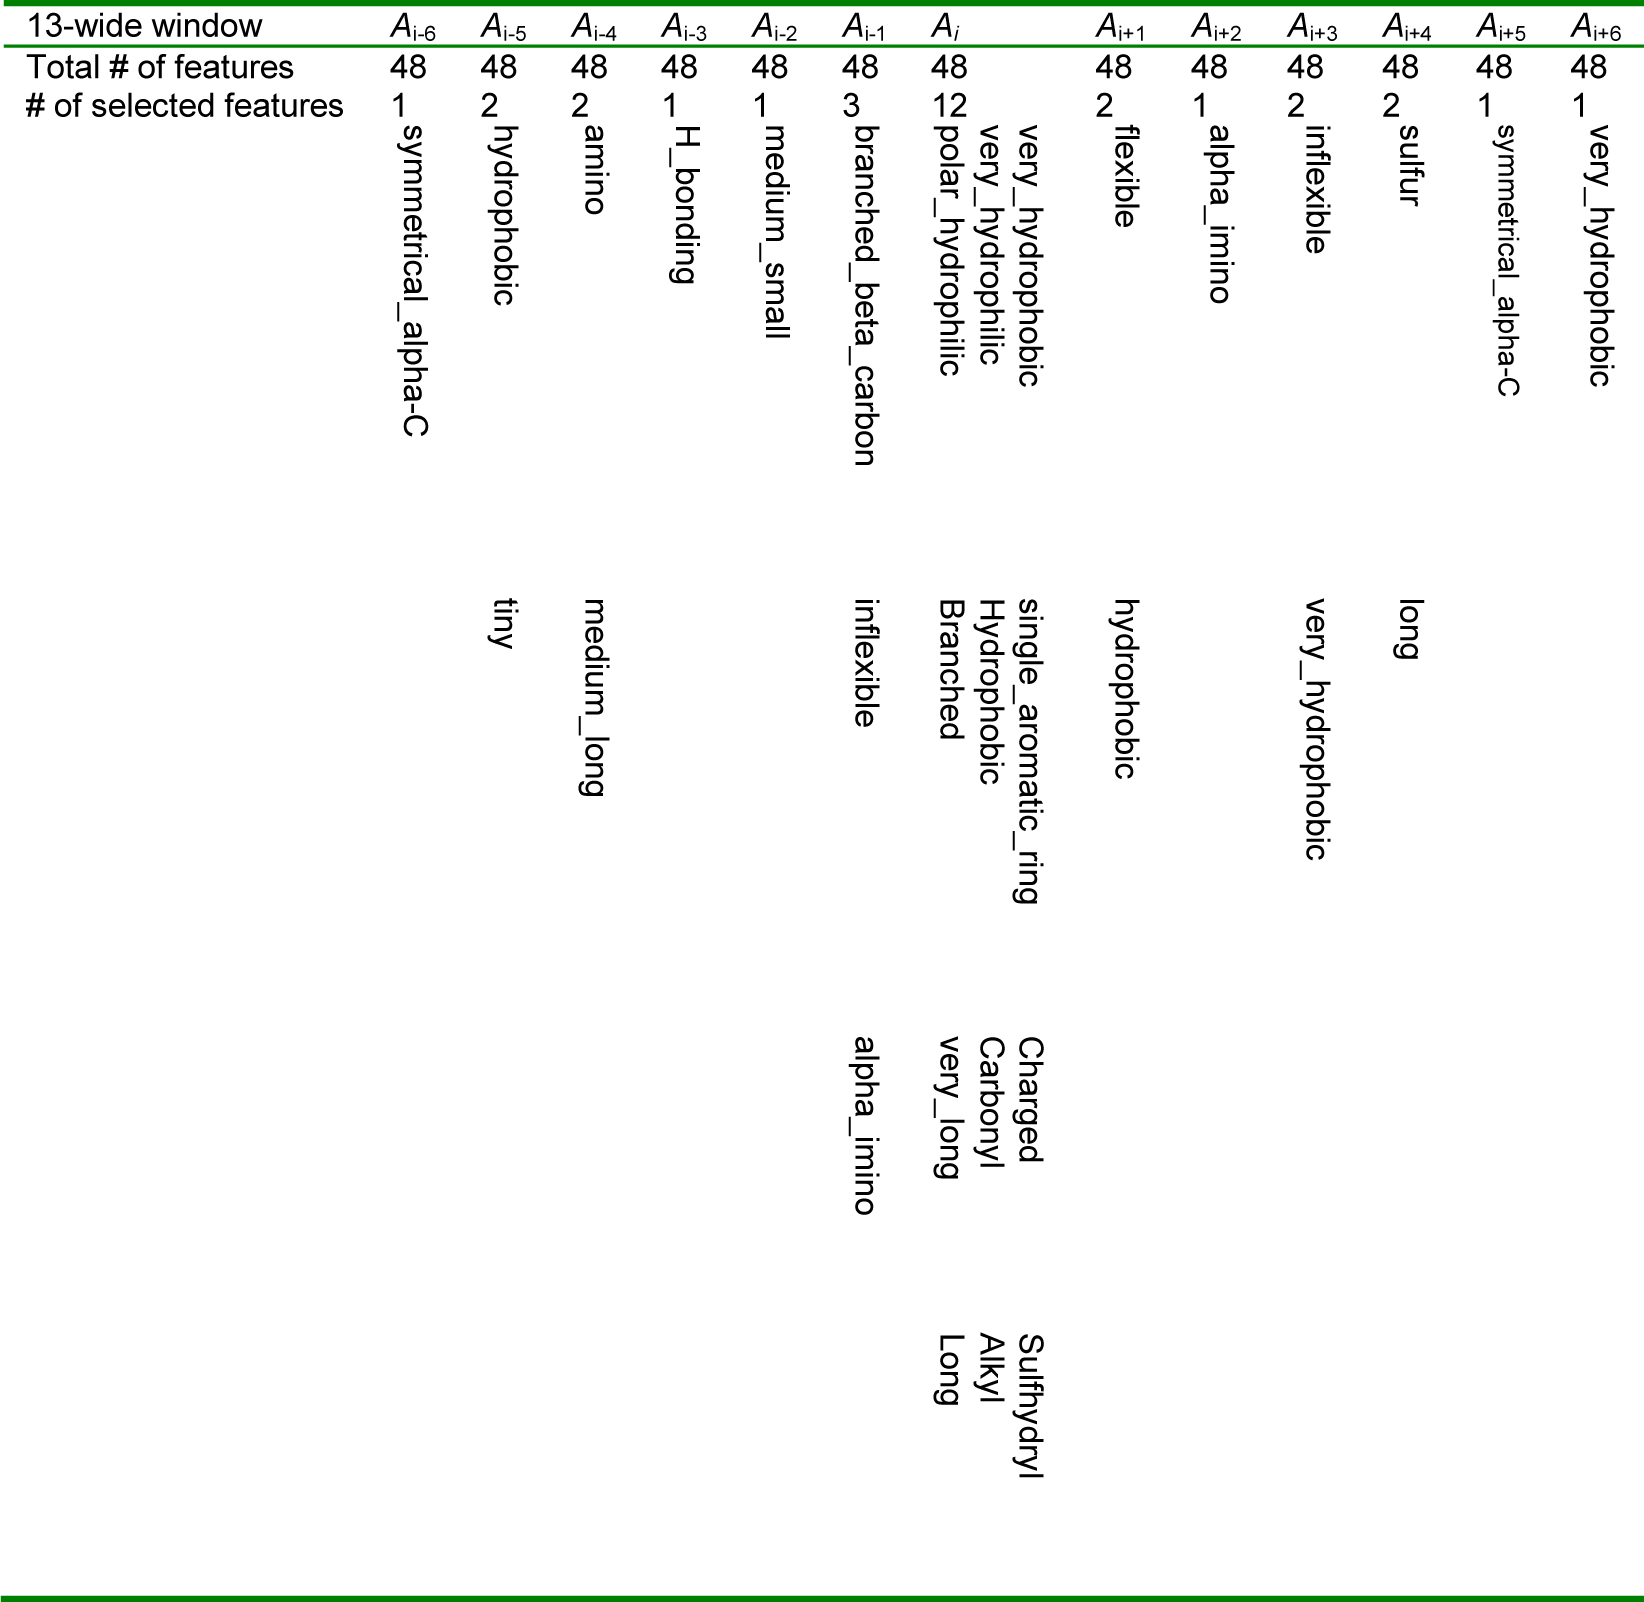
The Scatter Search method filters the redundancy among the features and selects the final number of selected features, which in our case were 32 features. Table 3(Tab. 3) shows selected qualitative features for the residue Ai that is located in the center of the window with size 13.
Among the 13*48 qualitative features, only 31 features deemed more significant for prediction of RSA in a given window. The first step of our method discover all the valuable knowledge about correlation between selected qualitative features and the RSA prediction of the centered amino acid, such as:
- The most physicochemical features of central amino acid i.e. Ai have significant impact on the RSA prediction. Interestingly, qualitative features of further residues have relatively small influence at the RSA prediction of the centered amino acid.
- The residues which are located in positions Ai-6, Ai+2 and Ai+5, have too low impact on the RSA prediction of the central amino acid.
- Hydrophilicity, hydrophobicity, length, flexibility and inflexibility features of amino acids have strong relationship with RSA values because these features are found in many positions of the window in Table 3(Tab. 3).
- Among the 48 physicochemical features of amino acids, only 22 distinct physicochemical features have strong relationships with protein solvent accessibility.
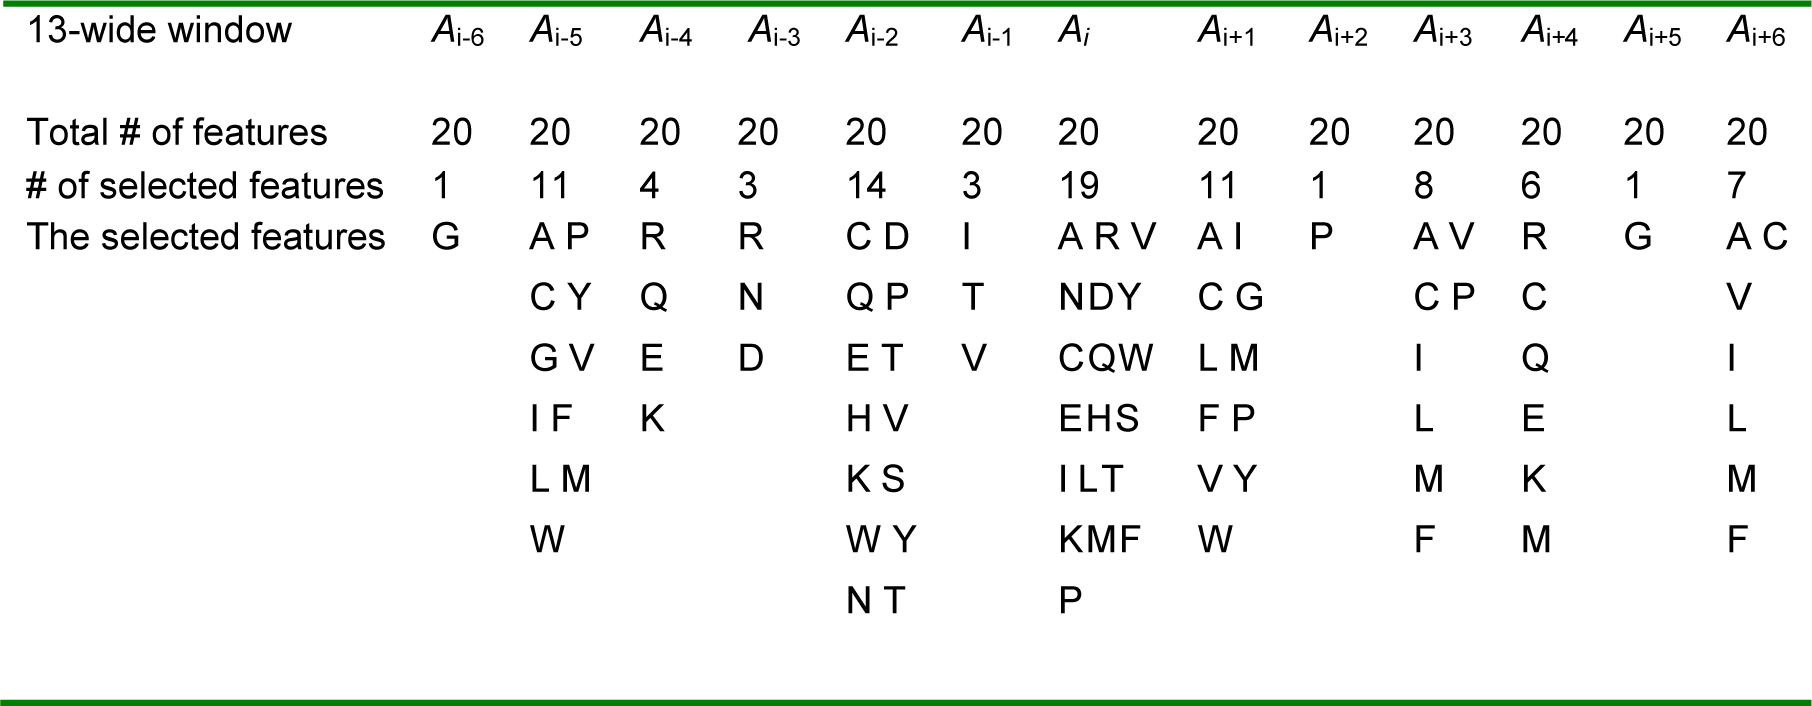
Whenever, the subset of qualitative features is produced, a set of amino acids that have those selected properties is chosen in each position of window. For example, in position Ai+1, if flexibility or hydrophobic properties are selected, we select only amino acids that have at least one of those properties in that position. Finally, we have a subset of PSI-BLAST profile features, which were used for training model in the second step, see Table 4(Tab. 4).
The selected features include 89 features from the PSI-BLAST profile and one binary value that correspond with the first and last residues in the sequence. We add this binary feature; because the amino acids that are located at the terminus of the sequence have larger probability of being exposed to the solvent, see Table 5(Tab. 5).
References
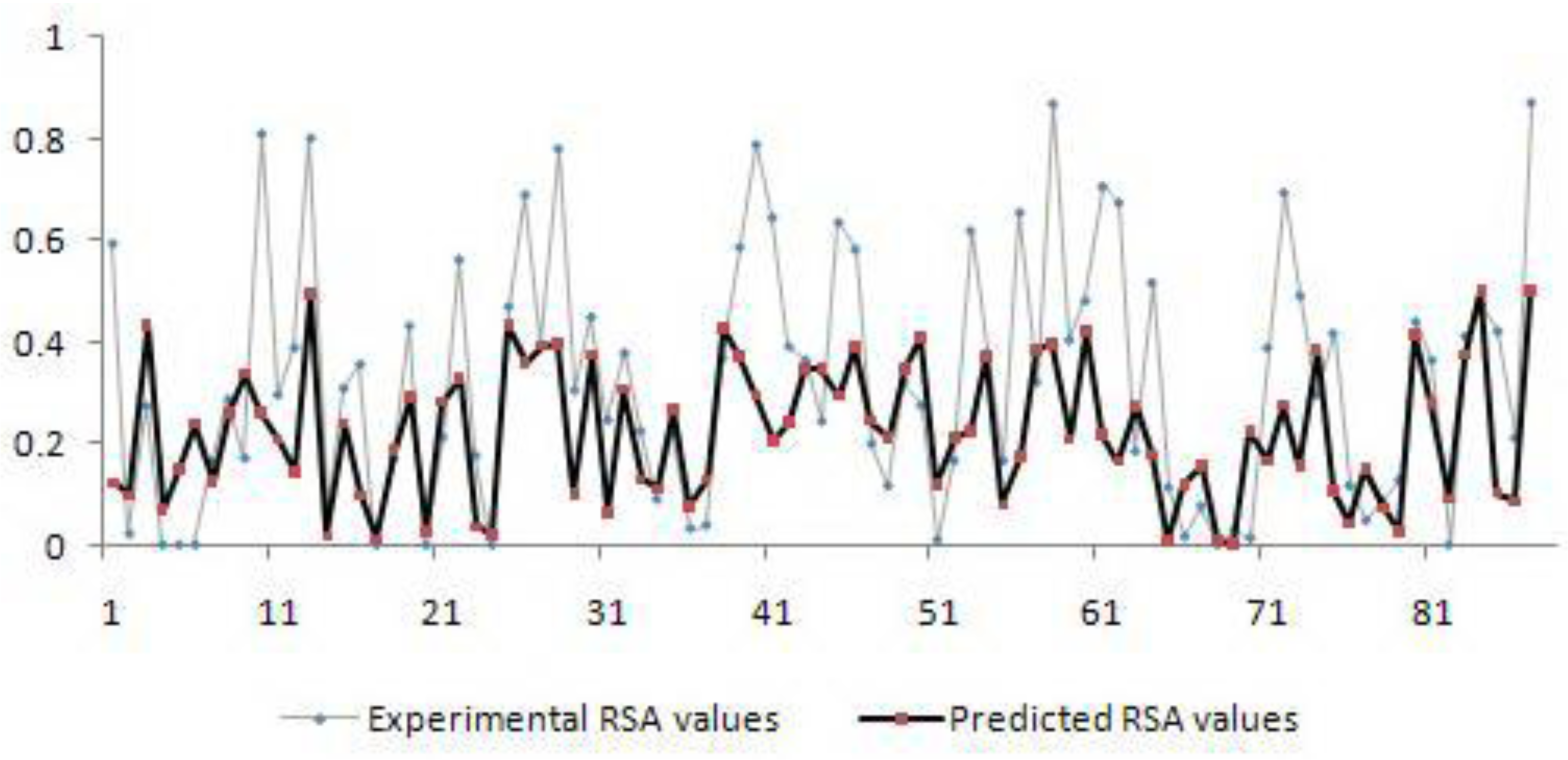
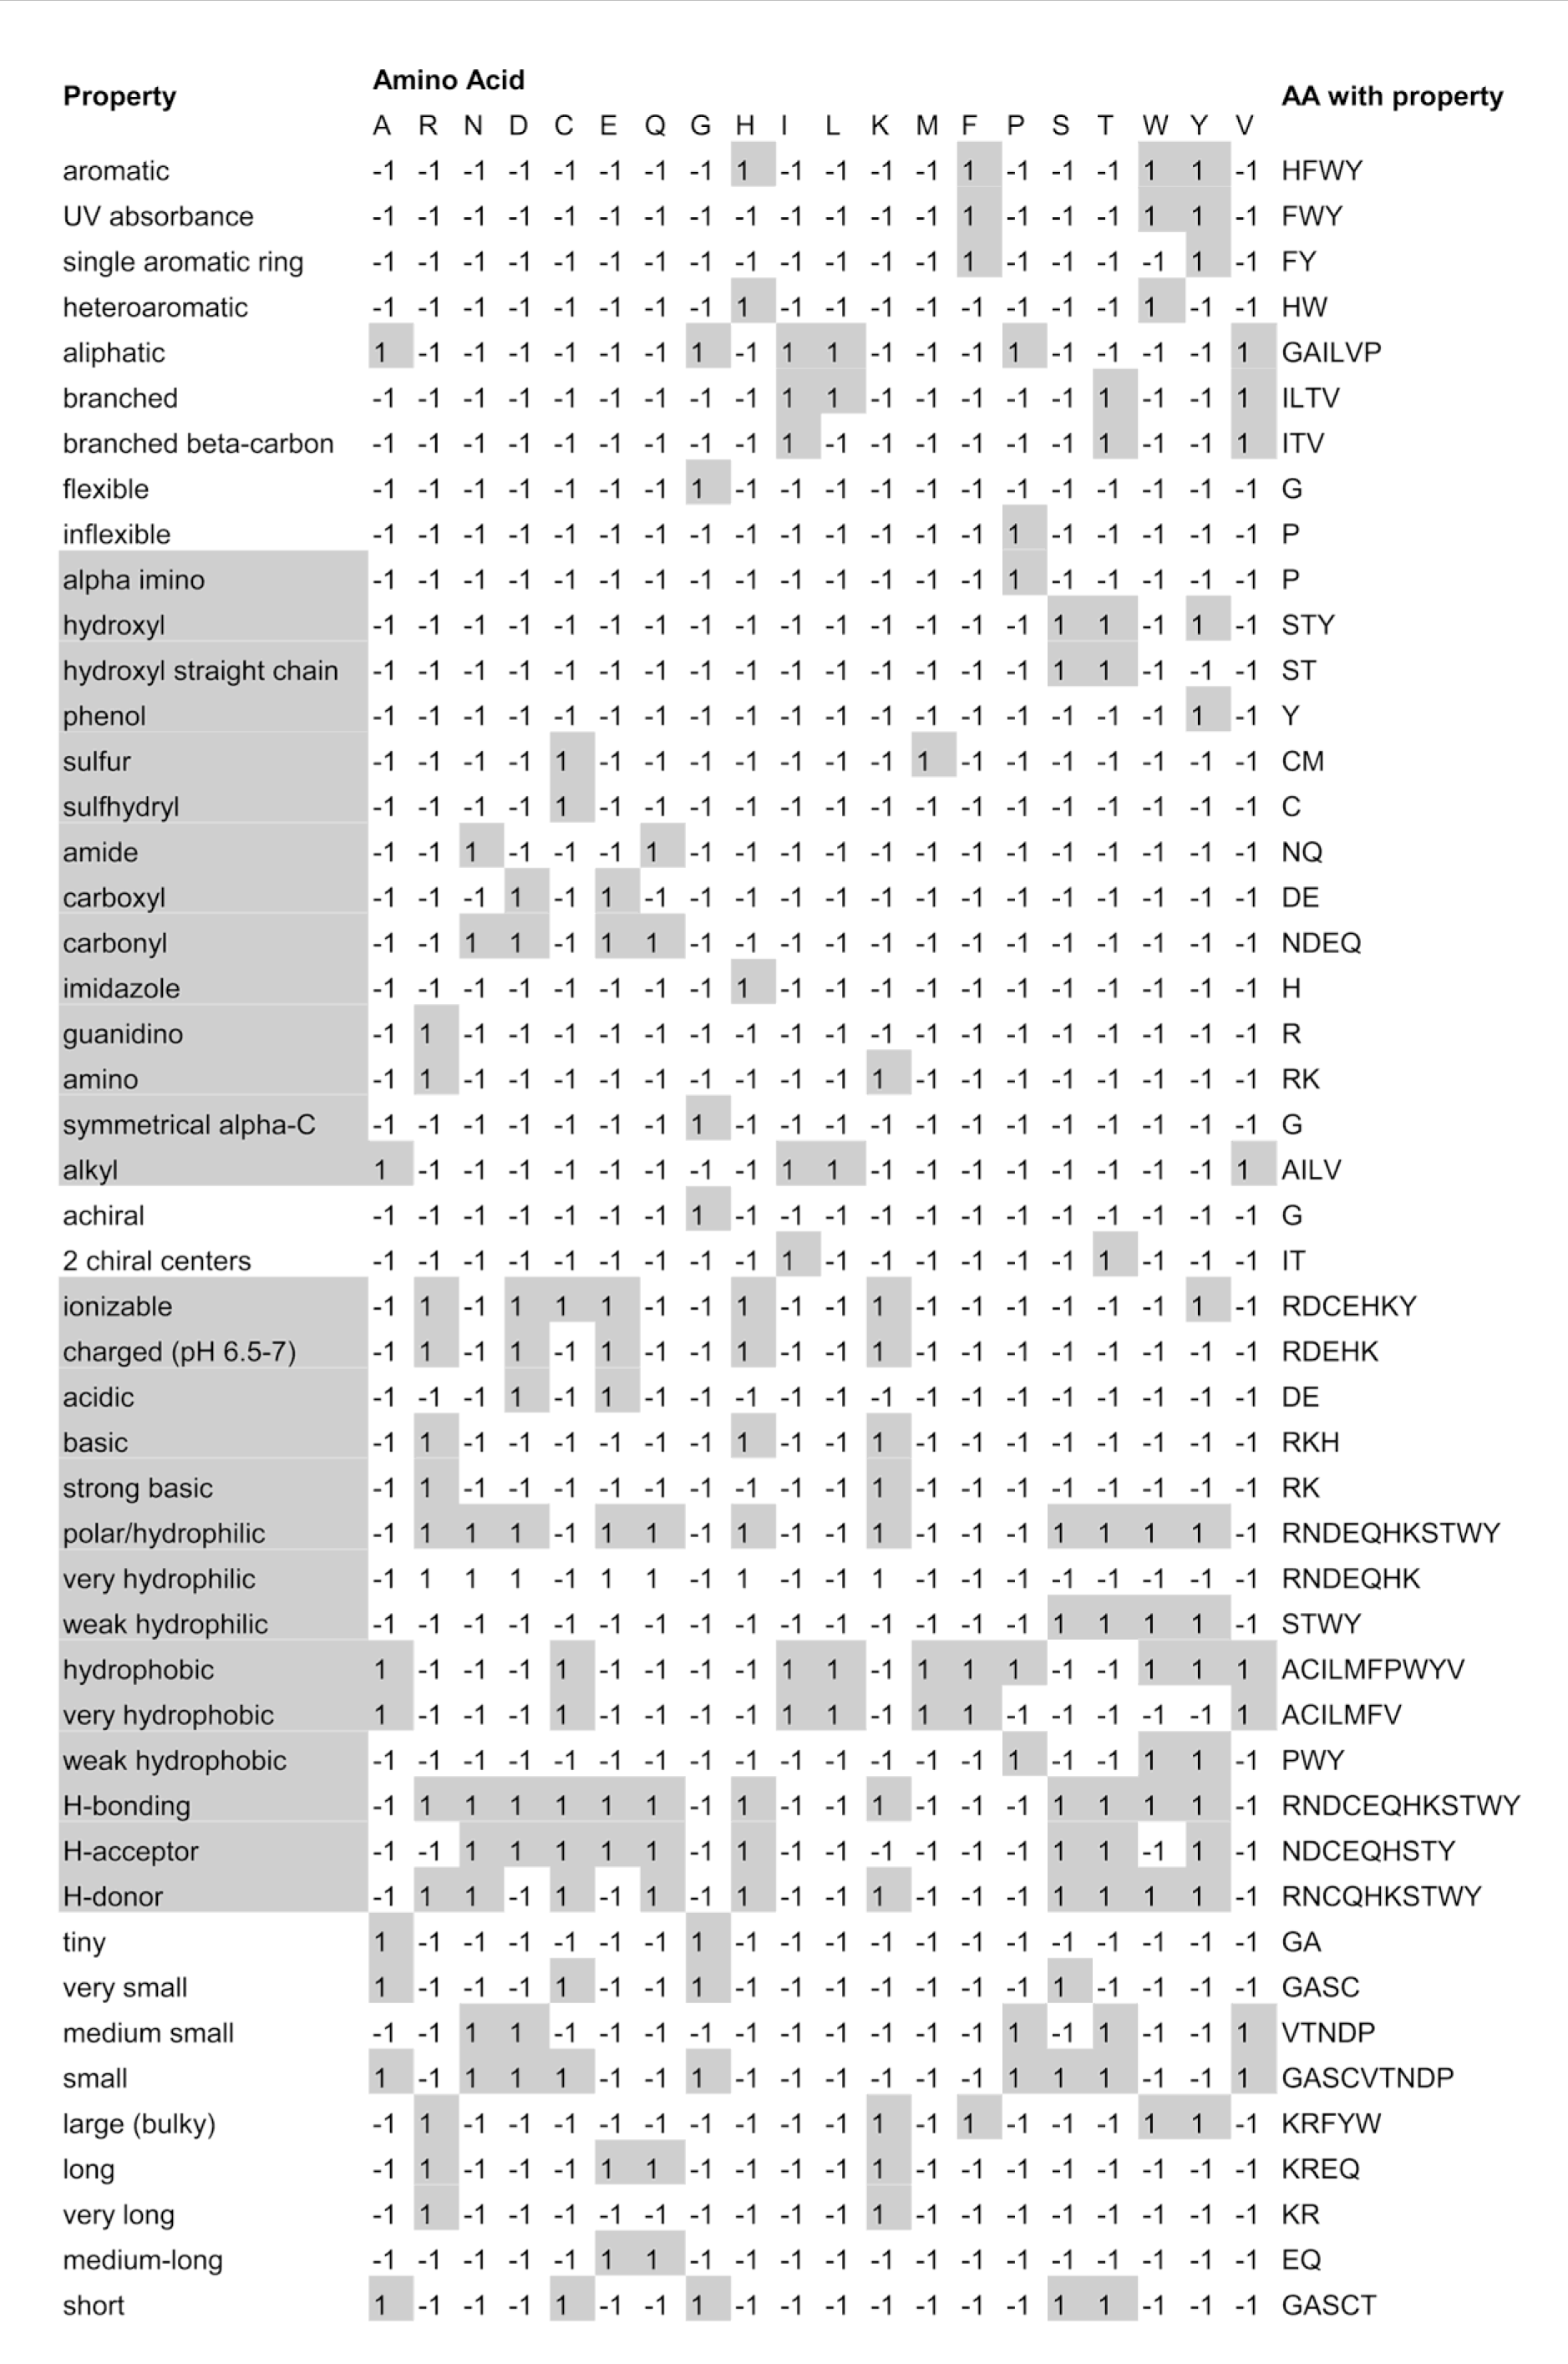
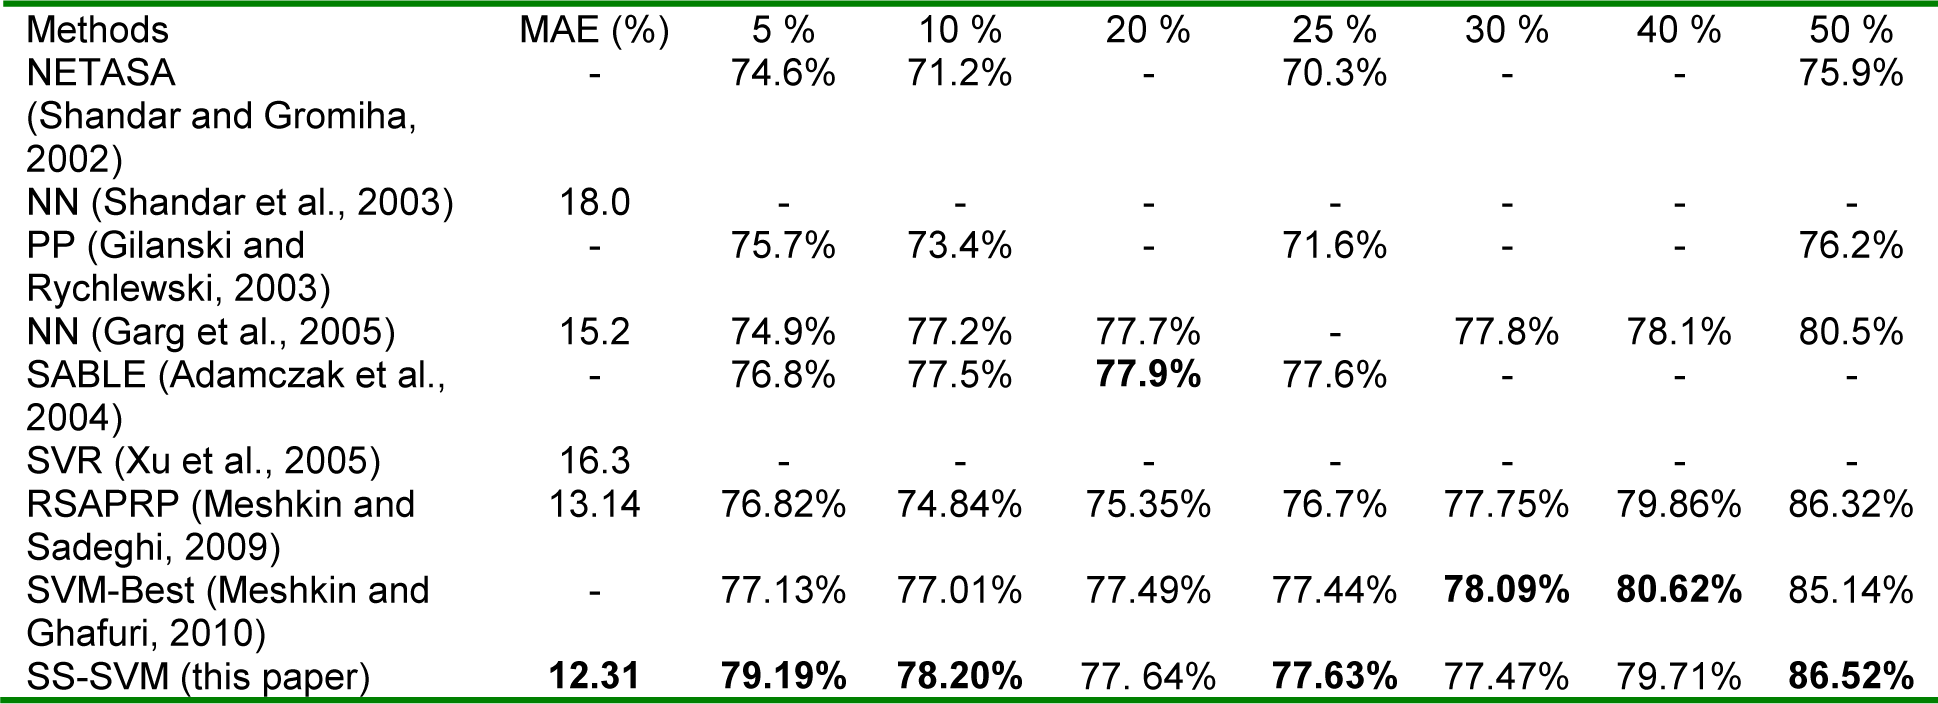
Table 1: Comparison between our method and other reported methods; unreported results are denoted by “-“.
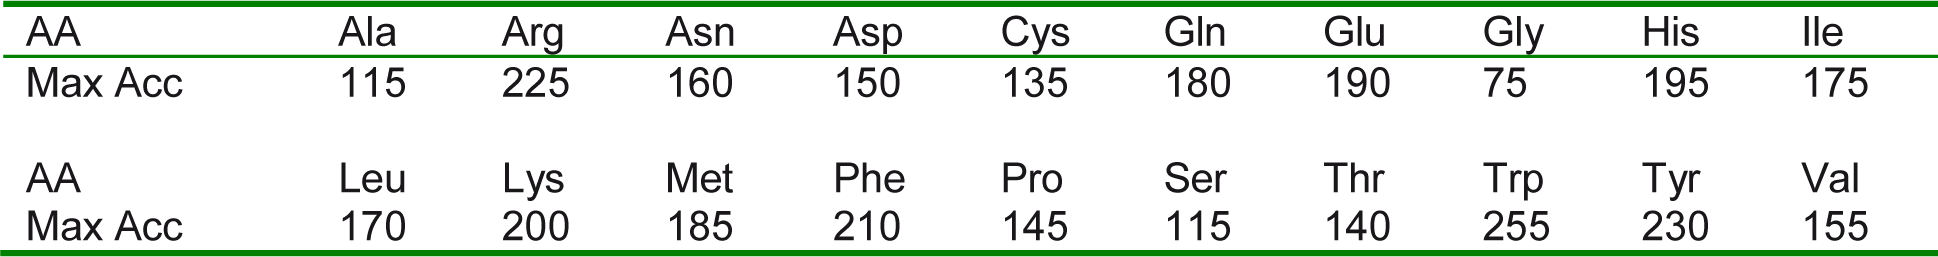
Table 2: Maximum Surface Accessibility (Max Acc) of the AAs (Å) in Extended tripeptide Gly-X-Gly Conformation
[*] Corresponding Author:
Alireza Meshkin, Department of Computer Engineering, Islamic Azad University, Damavand Branch, Damavand, Iran, eMail: meshkin@nigeb.ac.ir