Research article
Machine learning approaches for discerning intercorrelation of hematological parameters and glucose level for identification of diabetes mellitus
Apilak Worachartcheewan1, Chanin Nantasenamat1[*],2, Pisit Prasertsrithong2, Jakraphob Amranan2, Teerawat Monnor1, Tassaneya Chaisatit3, Wilairat Nuchpramool3, Virapong Prachayasittikul2
1Center of Data Mining and Biomedical Informatics, Faculty of Medical Technology, Mahidol University, Bangkok 10700, Thailand2Department of Clinical Microbiology and Applied Technology, Faculty of Medical Technology, Mahidol University, Bangkok 10700, Thailand
3International Center for Medical and Radiological Technology, Golden Jubilee Medical Center, Faculty of Medical Technology, Mahidol University, Bangkok 10700, Thailand
EXCLI J 2013;12:Doc885
Abstract
Background: The aim of this study is to explore the relationship between hematological parameters and glycemic status in the establishment of quantitative population-health relationship (QPHR) model for identifying individuals with or without diabetes mellitus (DM).
Methods: A cross-sectional investigation of 190 participants residing in Nakhon Pathom, Thailand in January-March, 2013 was used in this study. Individuals were classified into 3 groups based on their blood glucose levels (normal, Pre-DM and DM). Hematological (white blood cell (WBC), red blood cell (RBC), hemoglobin (Hb) and hematocrite (Hct)) and glucose parameters were used as input variables while the glycemic status was used as output variable. Support vector machine (SVM) and artificial neural network (ANN) are machine learning approaches that were employed for identifying the glycemic status while association analysis (AA) was utilized in discovery of health parameters that frequently occur together.
Results: Relationship amongst hematological parameters and glucose level indicated that the glycemic status (normal, Pre-DM and DM) was well correlated with WBC, RBC, Hb and Hct. SVM and ANN achieved accuracy of more than 98 % in classifying the glycemic status. Furthermore, AA analysis provided association rules for defining individuals with or without DM. Interestingly, rules for the Pre-DM group are associated with high levels of WBC, RBC, Hb and Hct.
Conclusion This study presents the utilization of machine learning approaches for identification of DM status as well as in the discovery of frequently occurring parameters. Such predictive models provided high classification accuracy as well as pertinent rules in defining DM.
Keywords: diabetes mellitus, glucose, hematologic parameters, quantitative population-health relationship, QPHR, data mining
Introduction
Diabetes mellitus (DM) is defined as a group of metabolic disorders characterized by increasing blood glucose or hyperglycemia that occur as a result of defects in insulin secretion, insulin action or insulin resistance (IR) (Salsali and Nathan, 2006[15]). DM can be classified as type 1 (i.e. non-secretion of insulin) and type 2 (i.e., defined by IR) (Salsali and Nathan, 2006[15]). DM is a complicated disease affecting multiple tissues in the body as it impairs organ function or biochemical parameters leading to expression of clinical signs and symptoms (Salsali and Nathan, 2006[15]). Finally, without proper diagnosis or treatment, morbidity or mortality can occur.
Hematological parameters, such as white blood cell (WBC), red blood cell (RBC), hemoglobin (Hb) and hematocrit (Hct) that had previously been found to be correlated with IR and metabolic syndrome (MS) (Chen et al., 2006[4]; Choi et al., 2003[5]; Jung et al., 2013[7]; Kawamoto et al., 2013[8]; Wang et al., 2004[17]), a condition predisposing individuals to the development of DM and/or cardiovascular diseases (Alberti et al., 2009[2]). These parameters are implied to be related to glycemic status in which there may be involvement with inflammatory response or blood flow in the body. Therefore, those parameters may be used for identifying individuals with or without glycemic condition.
Machine learning techniques are computational approaches that are used in extracting pertinent knowledge from large amounts of data and it has previously been applied for various clinical decision-making process such as metabolic syndrome (Kim et al., 2012[10]; Worachartcheewan et al., 2013[21]), diabetes mellitus (Quentin-Trautvetter et al., 2002[14]; Yu et al., 2010[22]), cancer (Nahar et al., 2011[12]) and hypertension (Shin et al., 2010[16]). The aim of this study is to classify individuals as normal, Pre-DM and DM using the quantitative population-health relationship (QPHR) approach employing machine learning approaches such as support vector machine, artificial neural network and association rule analysis.
Material and Methods
Sample population
A sample population of 190 individuals (i.e., comprising of 71 males and 119 females) residing in Nakhon Pathom, Thailand and receiving health check-up from the International Center for Medical and Radiological Technology, Golden Jubilee Medical Center, Faculty of Medical Technology, Mahidol University during the duration of January-March, 2013 was used in this study.
Blood chemical measurements
Individuals were described by a set of health parameters encompassing blood chemical tests including blood glucose, total cholesterol (Chol), triglyceride (TG), low-density lipoprotein cholesterol (LDL-C), high-density lipoprotein cholesterol (HDL-C) while hematological parameters comprising of WBC, RBC, Hb and Hct. These parameters were determined by standard methods. Blood chemistry testings were stratified according to guidelines of the WHO (Wilson, 2009[18]). Hematological parameters were divided into four groups based on their quartiles.
Machine learning analysis
Support vector machine (SVM) and artificial neural network (ANN) implementing the John Platt's Sequential Minimal Optimization algorithm (Witten et al., 2011[19]) and the back-propagation algorithm (Nantasenamat et al., 2007[13]), respectively, were employed in constructing classification models using WEKA, version 3.4.5 (Witten et al., 2011[19]). In SVM models, the input data were transformed to higher dimensional space by means of the radial basis function kernel (Worachartcheewan et al., 2013[21]) Hematological parameters and glucose level were used as input variables and the DM status (i.e., normal, Pre-DM and DM) was used as the output variable. Data sampling was performed by means of ten-fold cross-validation (10-fold CV).
Statistical analysis
Statistical analysis was performed using SPSS Statistics 18.0 (SPSS Inc. USA) in which P-value of < 0.05 was considered statistically significant. The predictive performance of the classification models was evaluated from its accuracy. In addition, association analysis (AA) was performed in SPSS Clementine, version 11.1 (SPSS Inc., USA) employing the Apriori algorithm (Agrawal et al., 1993[1]) to discover frequently occurring parameters in individuals with DM. Association rules was obtained by using minimum support and confidence values of minsup = 5 % and minconf = 70 %, respectively.
Results
Population characteristics and data pre-processing
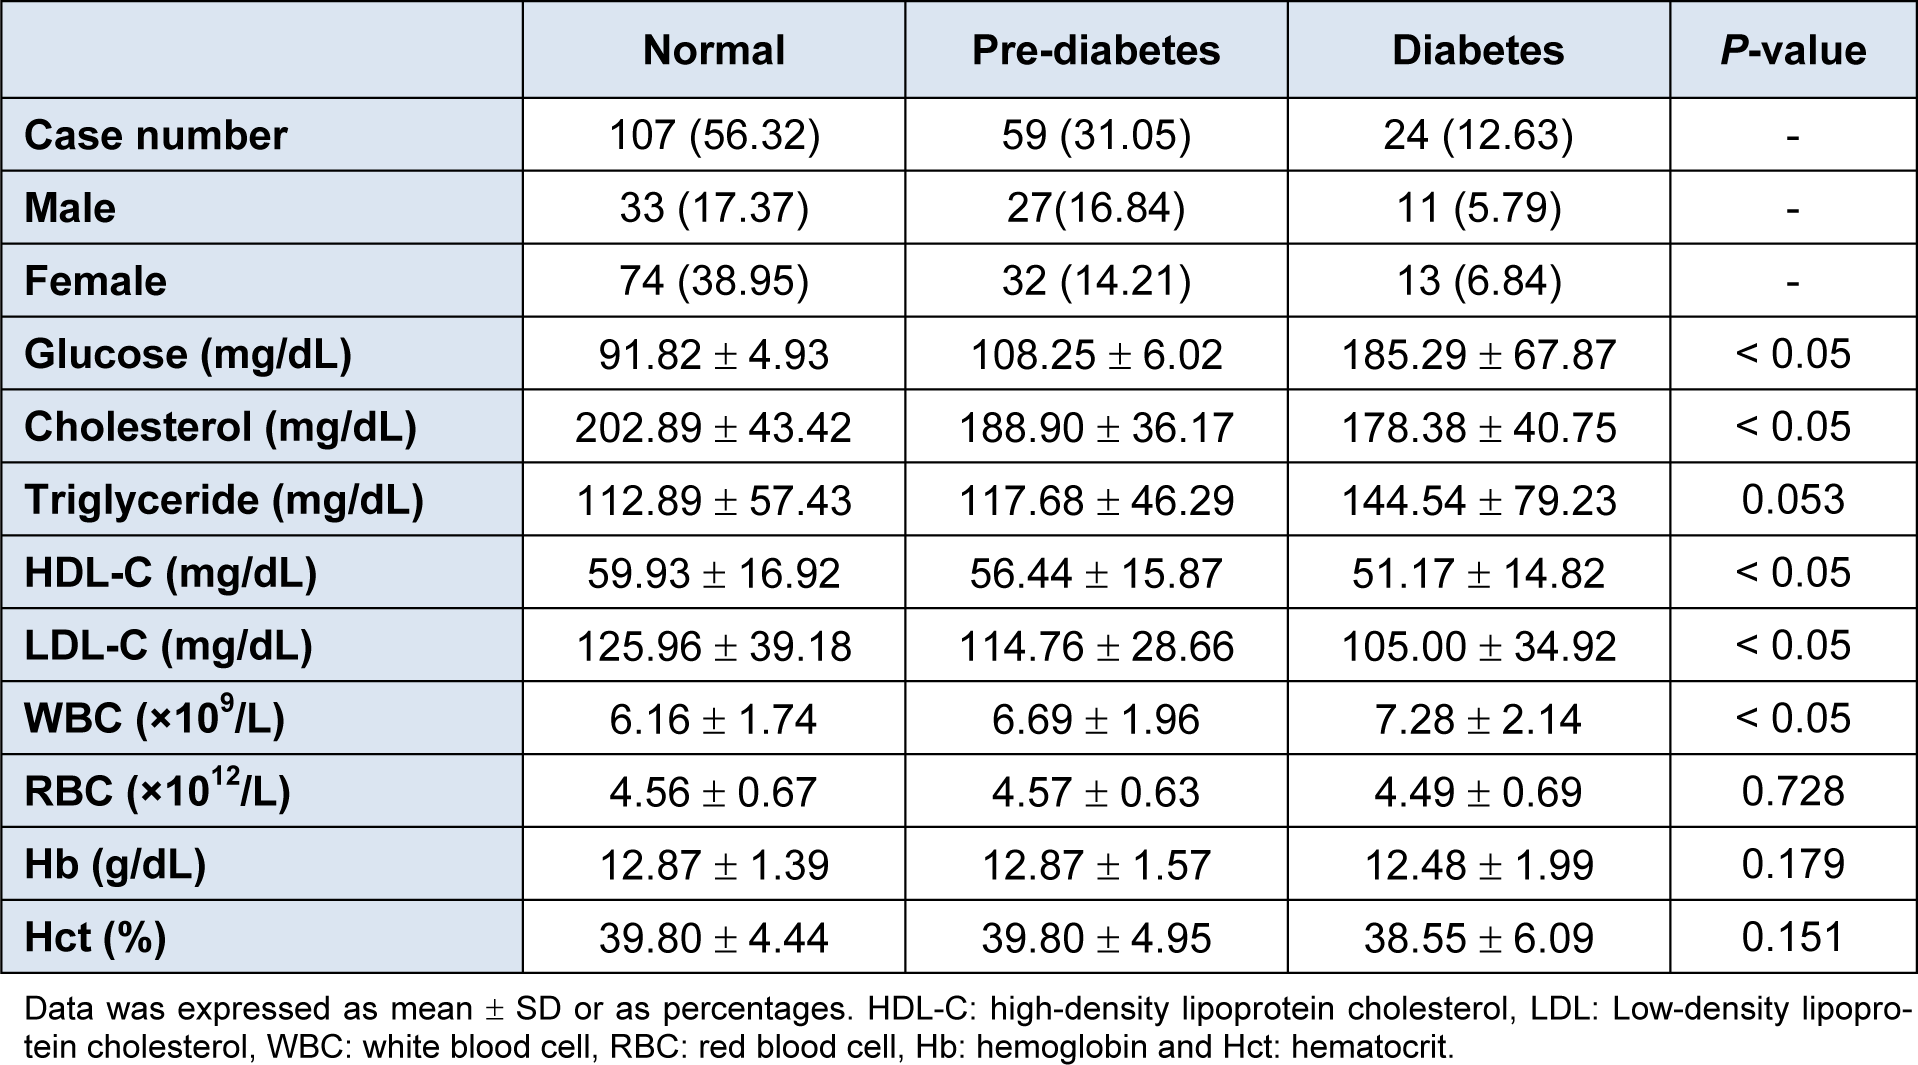
Table 1(Tab. 1) shows the biochemical features of 190 participants stratified by their glucose levels: normal for glucose < 100 mg/dL (i.e., comprising of 33 males and 74 females), Pre-DM for glucose 100 - 125 mg/dL (i.e., composed of 32 men and 27 women) and DM for glucose ≥ 126 mg/dL (i.e., comprising of 11 males and 13 females). In the DM group, the average values of glucose, TG and WBC were found to increase while Chol, HDL-C and LDL-C were found to decrease when compared to the other two groups. Interestingly, TG and HDL-C levels were shown to increase and decrease, respectively, in the Pre-DM and DM groups when compared to the normal group. Such observation coincides with the known fact that individuals with MS have increased TG and decreased HDL-C levels (Alberti et al., 2009[2]). Furthermore, Hb, Hct and RBC were non-significant in the three groups. Box plots of biochemical parameters are presented in Figure 1(Fig. 1). As shown in Figure 2(Fig. 2), an intercorrelation matrix was constructed to discern relationships amongst investigated descriptors and it was found that the glycemic status was correlated with RBC, Hb and Hct as observed from the increasing correlation from the normal group to the Pre-DM group and finally the DM group.
Classification via QPHR modeling
Hematological parameters comprising of WBC, RBC, Hb, Hct and glucose were used as input variables while DM, Pre-DM and normal groups (i.e., as classified by their glucose level; Table 1(Tab. 1)) were used as the dependent variable. These variables were used in the construction of classification models using SVM and ANN methods. Furthermore, WBC, RBC, Hb and Hct parameters were binned into four groups on the basis of quartiles while other blood chemistry parameters were stratified according to the WHO guidelines (Table 2(Tab. 2)). These parameters were used in the discovery of biochemical parameters that frequently occur together with or without DM via the use of AA via the Apriori algorithm.
Support vector machine
In development of SVM classification models, C and Ɣ parameters were optimized by means of a two-step process in which a coarse global grid search was followed by a refined local grid search. The former searches values from 2-19 to 219 using an incremental increase in step size of 22, which gave C = 219 and Ɣ = 2-9 as global grid parameters affording 97.37 % of accuracy. A subsequent local grid search investigating regions spanning 217 to 223 was performed for the C parameter while the range of 2-11 to 2-7 was performed for the Ɣ parameter using step sizes of 20.25. Results indicated that optimal values for C and Ɣ parameters were 223 and 2-8.5, respectively, providing accuracies of 100 % and 98.42 % for the training set and 10-fold CV set, respectively, as shown in the confusion matrix presented in Table 3(Tab. 3).
Artificial neural network
In constructing ANN classification models, ANN parameters were optimized and it was found that the optimal values for the number of hidden nodes, learning epochs, learning rate and momentum are 6, 10000, 0.1 and 0.3, respectively. The resulting model afforded accuracies of 100 % and 98.42 % for the training set and 10-fold CV set, respectively, which shows similar prediction results as that of SVM (Table 3(Tab. 3)).
Association rule analysis
AA was employed to discover frequently occurring variables in individuals with DM or without DM. AA analysis gave rise to 533 rules that can be stratified as follows: 411 rules for the normal group, 111 rules for the Pre-DM group and 11 rules for the diabetes group as provided in supplementary informationSupplemental information.pdf (Tables S1-S3).
It is observed that rules for the diabetes group involved only abnormal glucose level 3 corresponding to glucose level of ≥ 126 mg/dL. Interestingly, rules for Pre-DM group are associated with increasing WBC, RBC, Hb and Hct affording levels of 2, 3 and 4 and glucose level of 2.
Discussion
IR is a condition in which target cells are not responsive to insulin levels in circulation and this leads to the development of diseases such as MS, chronic inflammation, diabetes and cardiovascular diseases (Salsali and Nathan, 2006[15]; Alberti et al., 2009[2]). In considering hematological parameters, immune cells such as WBC may be involved in inflammatory response in which the adipose tissue is a target in IR. Subsequently, the adipose tissue secretes inflammatory factors such as cytokines to activate the increase of WBC (Bermann and Sypniewska, 2013[3]). Hct and Hb have been documented to increase the levels of parameters related to high blood viscosity, consequently leading to a decrease in blood flow (de Simone et al., 1990[6]) and an increase in blood pressure (Kutlu et al., 2009[11]) as found in DM and Pre-DM groups, respectively. Furthermore, RBC was also found to be correlated with glycemic condition (Chen et al., 2006[4]; Choi et al., 2003[5]; Jung et al., 2013[7]; Kawamoto et al., 2013[8]; Wang et al., 2004[17]) in which the mechanism of increasing RBC indices in the presence of IR is not completely understood, however, it may be deduced to be involved in the increase of erythropoiesis in peripheral blood or involved in reducing blood flow and rising viscosity thereby leading to elevated RBC count (Kawamoto et al., 2013[8]).
Furthermore, hematological parameters were found to be correlated with glycemic conditions (Figure 2(Fig. 2)), which coincides with previous findings (Chen et al., 2006[4]; Choi et al., 2003[5]; Jung et al., 2013[7]; Kawamoto et al., 2013[8]; Wang et al., 2004[17]). Particularly, RBC, Hb and Hct were shown to exhibit significant association with glycemic status (i.e., normal, Pre-DM and DM) as shown in Figure 2(Fig. 2). Moreover, WBC was found to increase in both Pre-DM and DM groups (Table 1(Tab. 1)). Therefore, hematological parameters were used to classify individuals as having or not having DM.
Herein, the QPHR approach had successfully been shown to afford robust classification of glycemic status (i.e., normal, Pre-DM and DM) as a function of health parameters. The approach enables the correlation of biomedical parameters with their respective DM status. QPHR is a data mining approach previously termed by us and had been successfully employed in classifying MS (Worachartcheewan et al., 2010[20], 2013[21]) while relevant effort had been shown to be useful in classifying DM (Quentin-Trautvetter et al., 2002[14]; Yu et al., 2010[22]). Previously, these methods have been shown by us to yield accuracies of 91 - 98 % in the classification of MS status (Worachartcheewan et al., 2013[21]). Interestingly, AA identified abnormalities in hematological parameters (i.e., WBC, RBC, Hb and Hct) in the Pre-DM group while abnormal level of glucose (i.e. glucose level 3) was found in the DM group. Previously, AA was used to analyze the comorbidity in patients with type 2 DM (Kim et al., 2012[9]) and MS (Worachartcheewan et al., 2013[21]) as to understand the correlation between biomedical parameters with diseases. Considering that the level of glucose was already used for labeling individuals as having DM or non-DM, it was therefore pertinent in the resulting DM identification. The inclusion of hematological parameters (i.e., WBC, RBC, Hb and Hct) in classifying DM status still led to an accuracy of more than 98 %. Therefore, it may be implied that hematological parameters are important variables together with glucose level for the identification of DM status.
The QPHR study performed herein for the first time presents the utilization of complete blood cell count parameters (i.e., WBC, RBC, Hb and Hct) as descriptors in classification of DM status. Results support the fact that hematological parameters and glycemic condition are correlated, particularly, the strongest correlation was observed for the DM status group as corroborated by previous studies (Chen et al., 2006[4]; Choi et al., 2003[5]; Jung et al., 2013[7]; Kawamoto et al., 2013[8]; Wang et al., 2004[17]). Moreover, AA analysis suggests strong correlation between high levels of hematological parameters with the Pre-DM group (Table S2 in supplementary informationSupplemental information.pdf). The machine learning approaches (i.e., SVM and ANN) employed in this study have been shown to be capable of correctly classifying the DM status affording accuracies of more than 98 %. In addition, rules obtained from AA analysis may be used as guidelines for the prevention of individuals at risk for the development of DM.
Notes
Chanin Nantasenamat and Virapong Prachayasittikul (Department of Clinical Microbiology and Applied Technology, Faculty of Medical Technology, Mahidol University, Bangkok 10700, Thailand; phone: +66 2 441 4376, fax: +66 2 441 4380; virapong.pra@mahidol.ac.th) contributed equally as corresponding authors.
Acknowledgements
The annual budget grant of Mahidol University (B.E. 2556-2558) is gratefully acknowledged for supporting this research. The authors thank the International Center for Medical and Radiological Technology, Golden Jubilee Medical Center, Faculty of Medical Technology, Mahidol University for the data set used in this study.
References
File-Attachments
- Supplemental information.pdf (47.47 KB)
Supplemental information
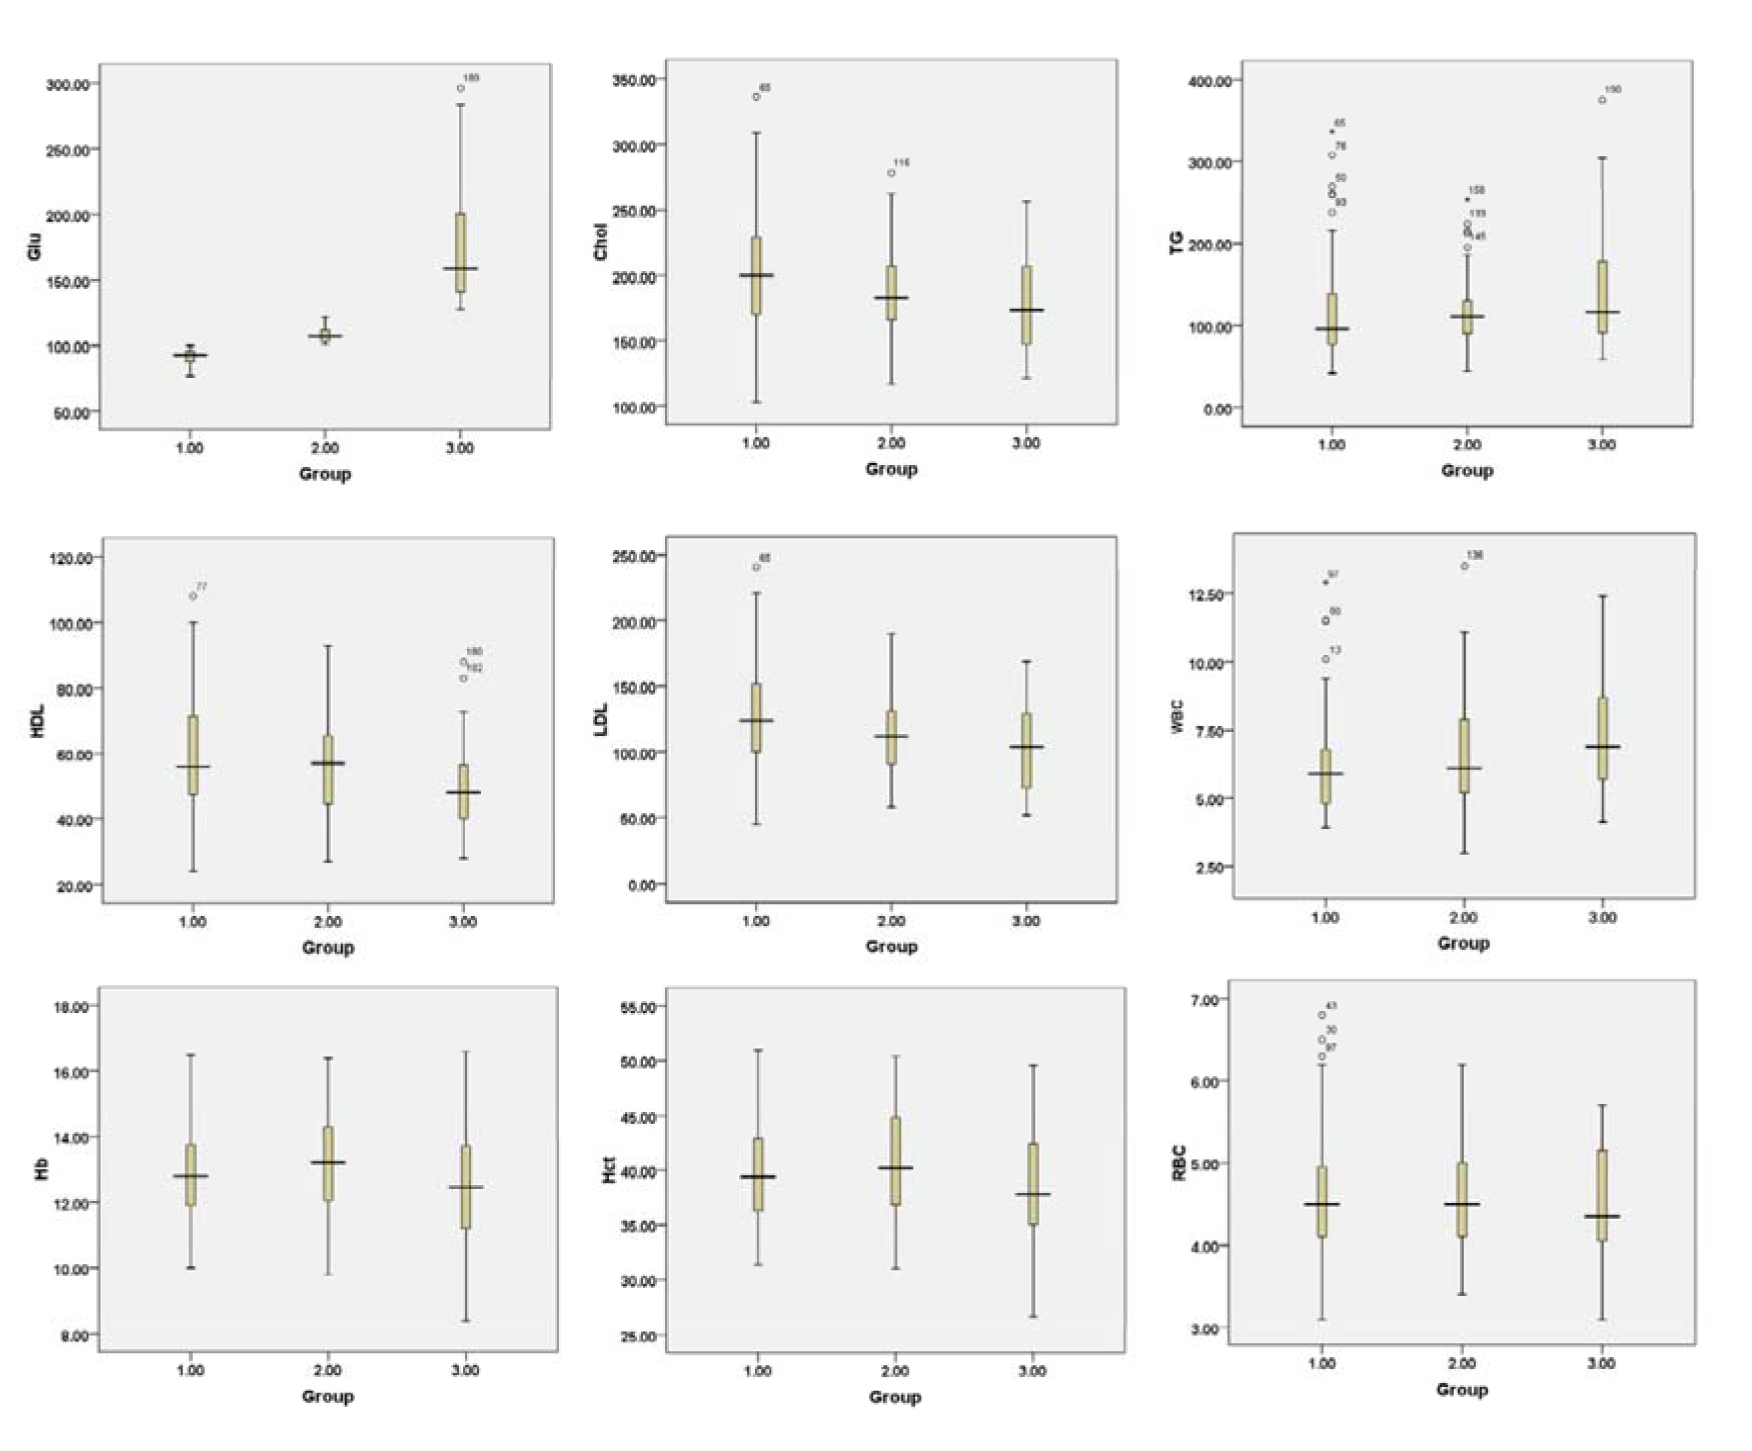
Figure 1: Box plots of biochemical parameters were stratified by their glycemic status to normal (a), Pre-DM (b) and DM (c) groups
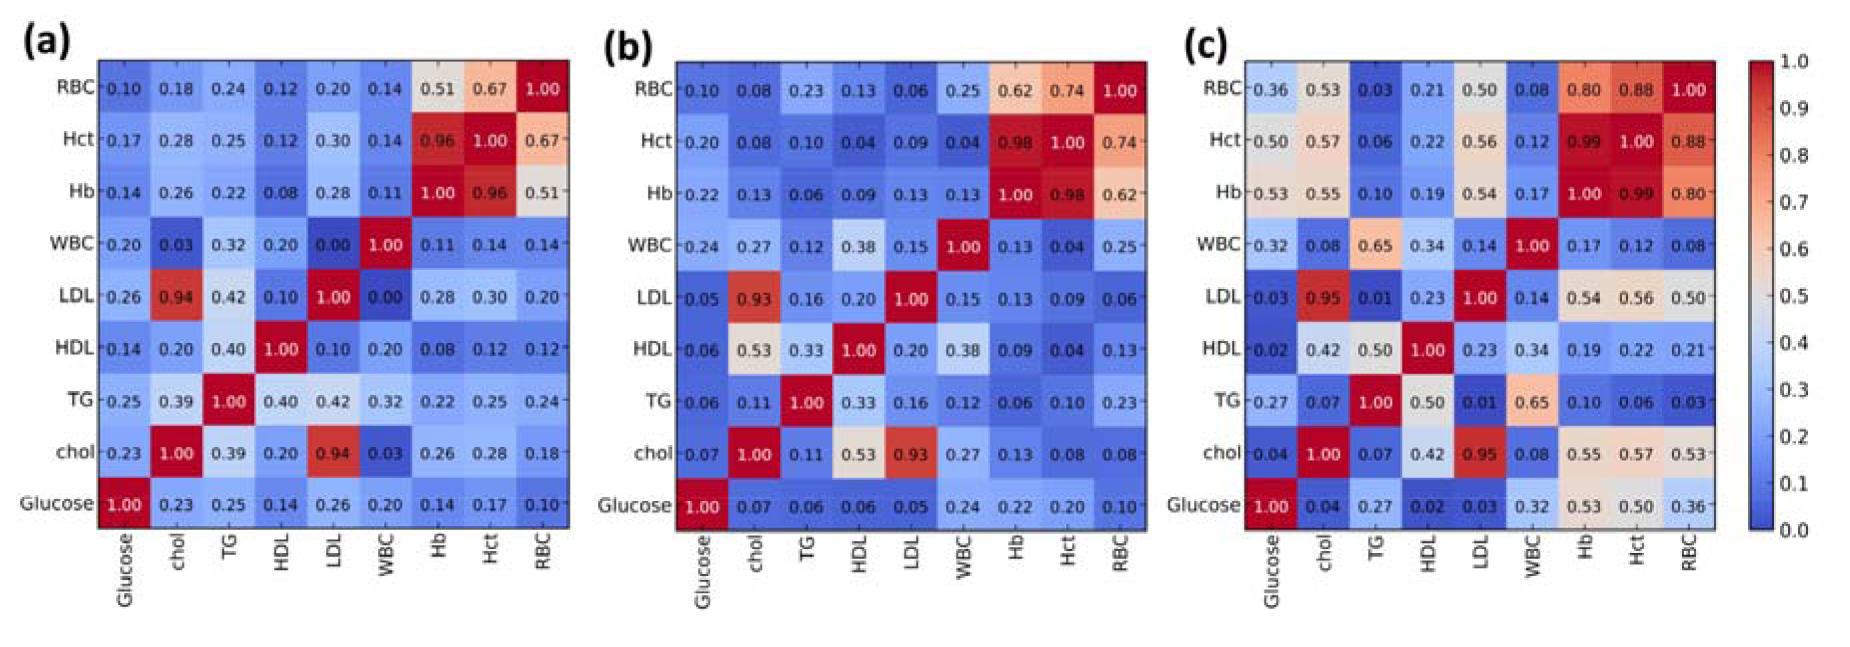
Figure 2: Intercorrelation matrix of biochemical and hematological parameters for normal (a), Pre-DM (b) and DM (c) groups
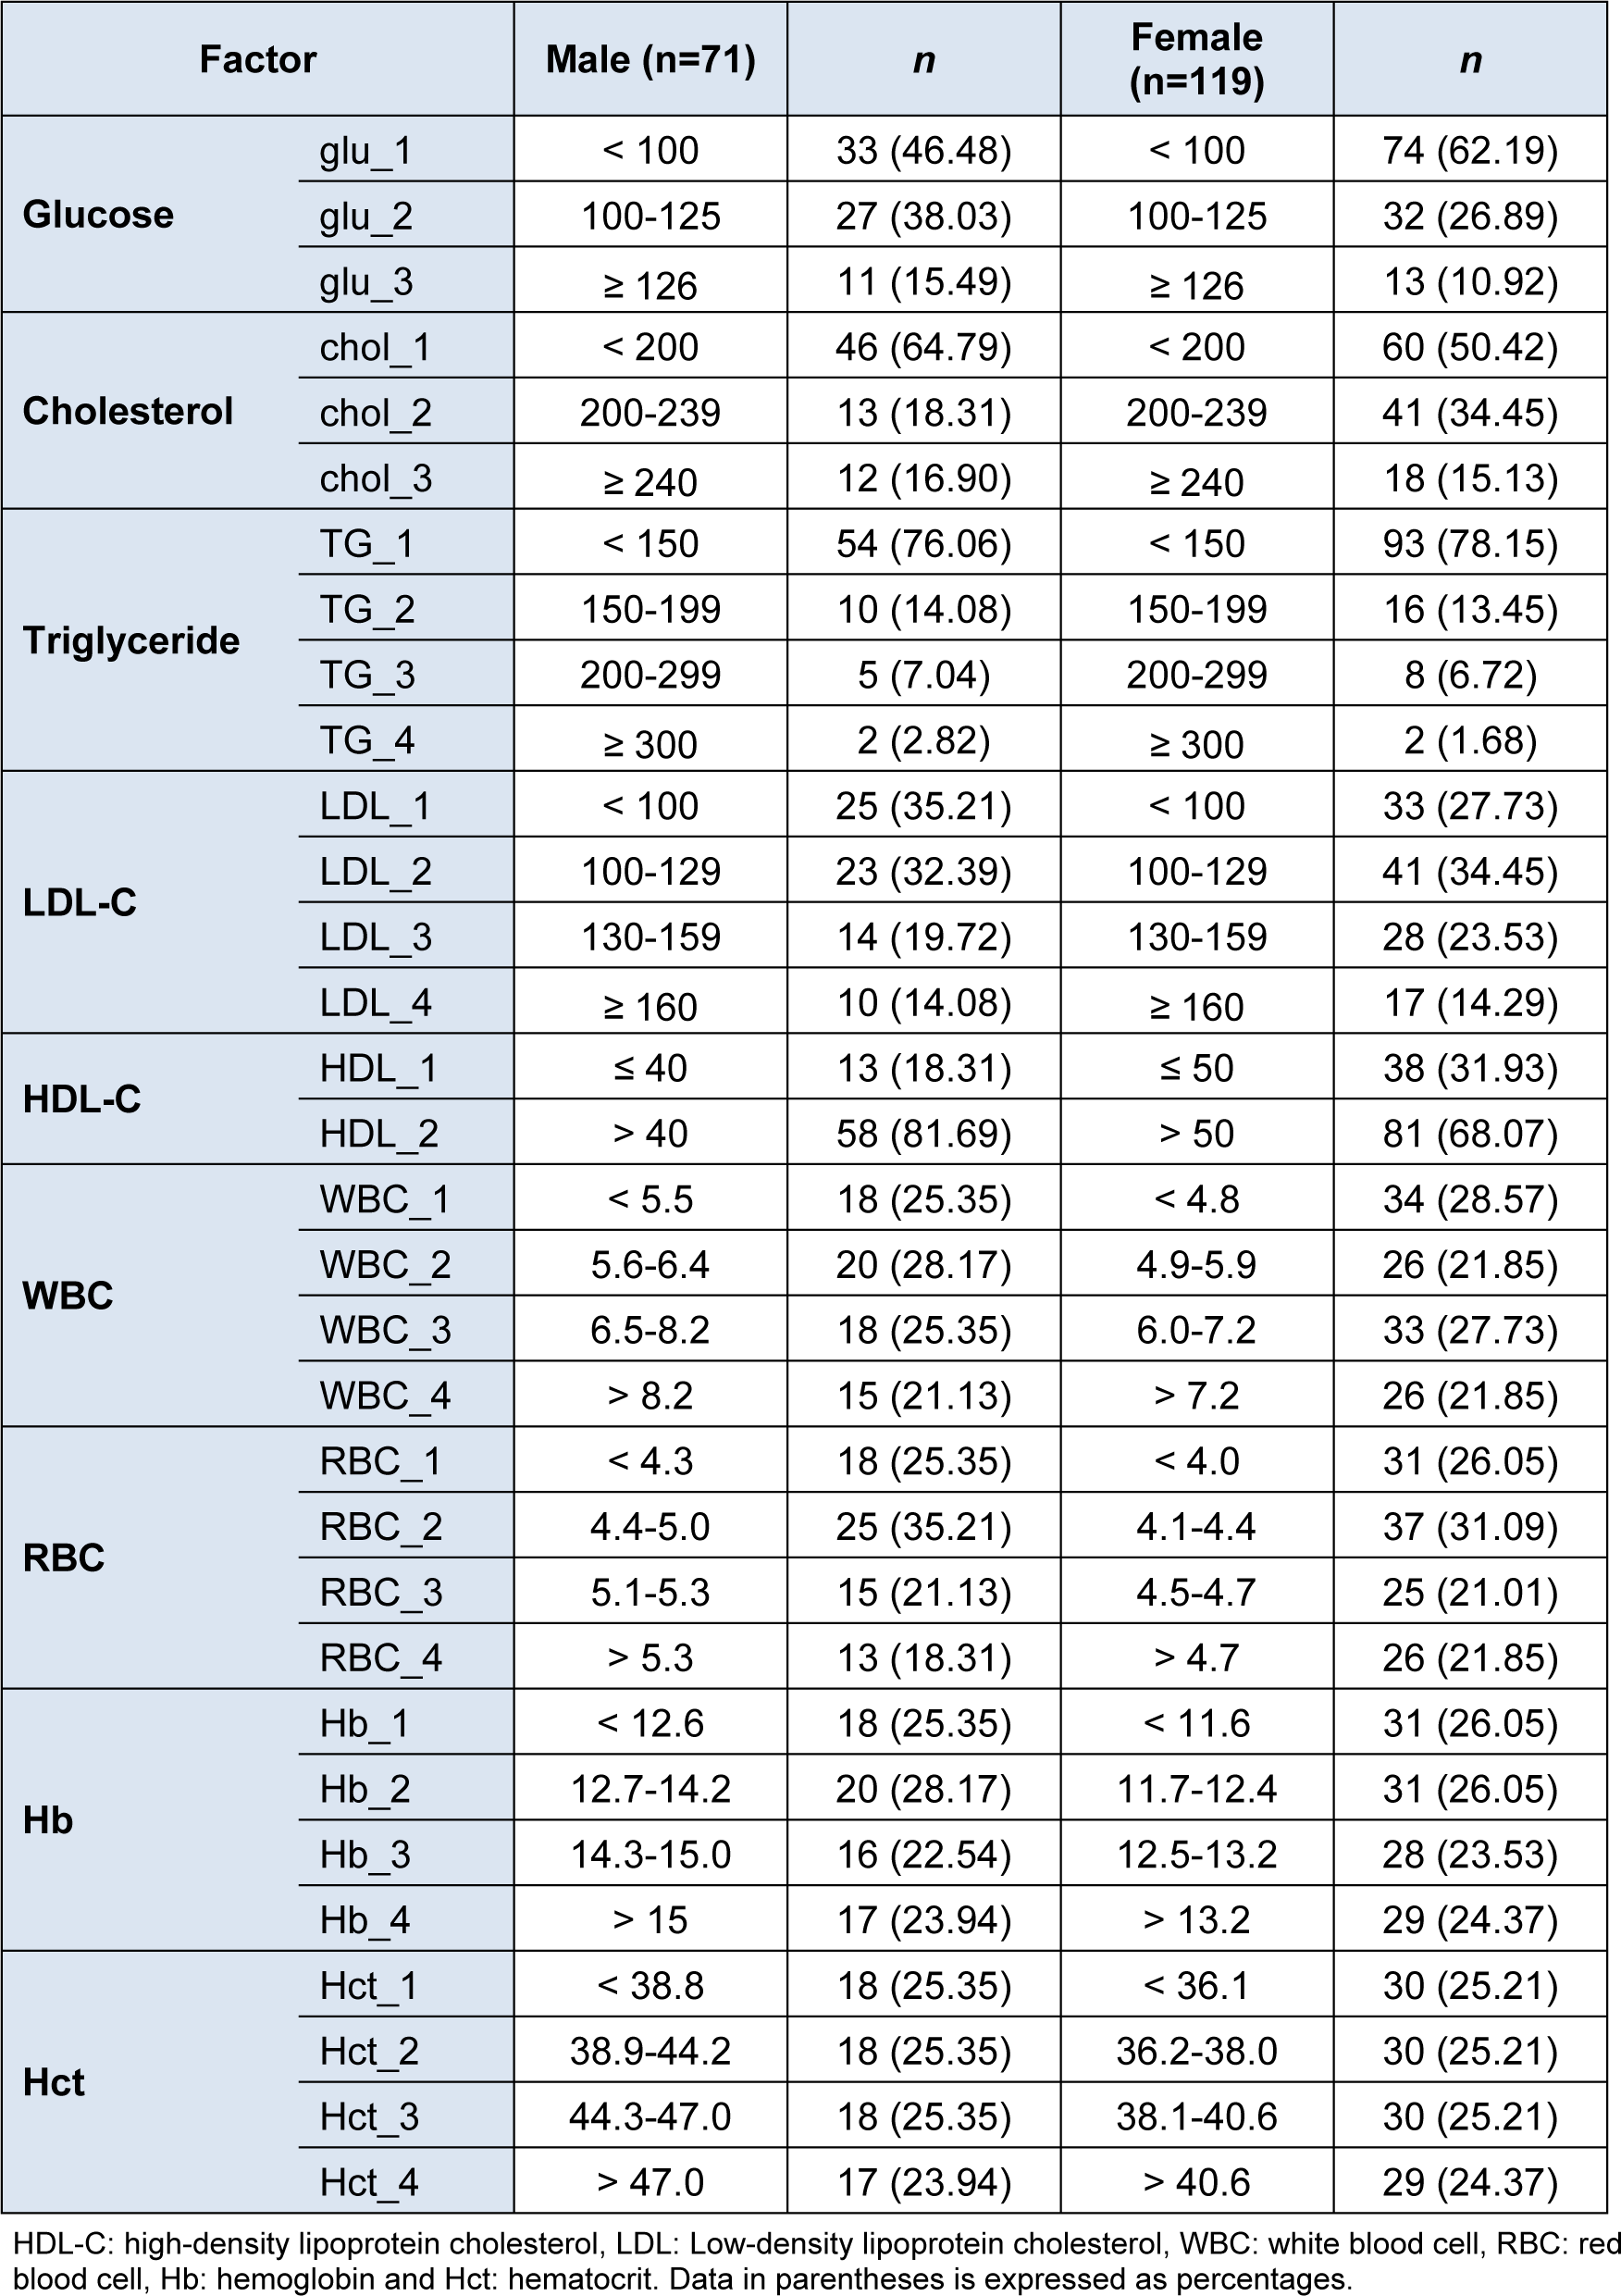
Table 2: Binning of biochemical parameters. Each parameter was stratified according to guidelines of the WHO.
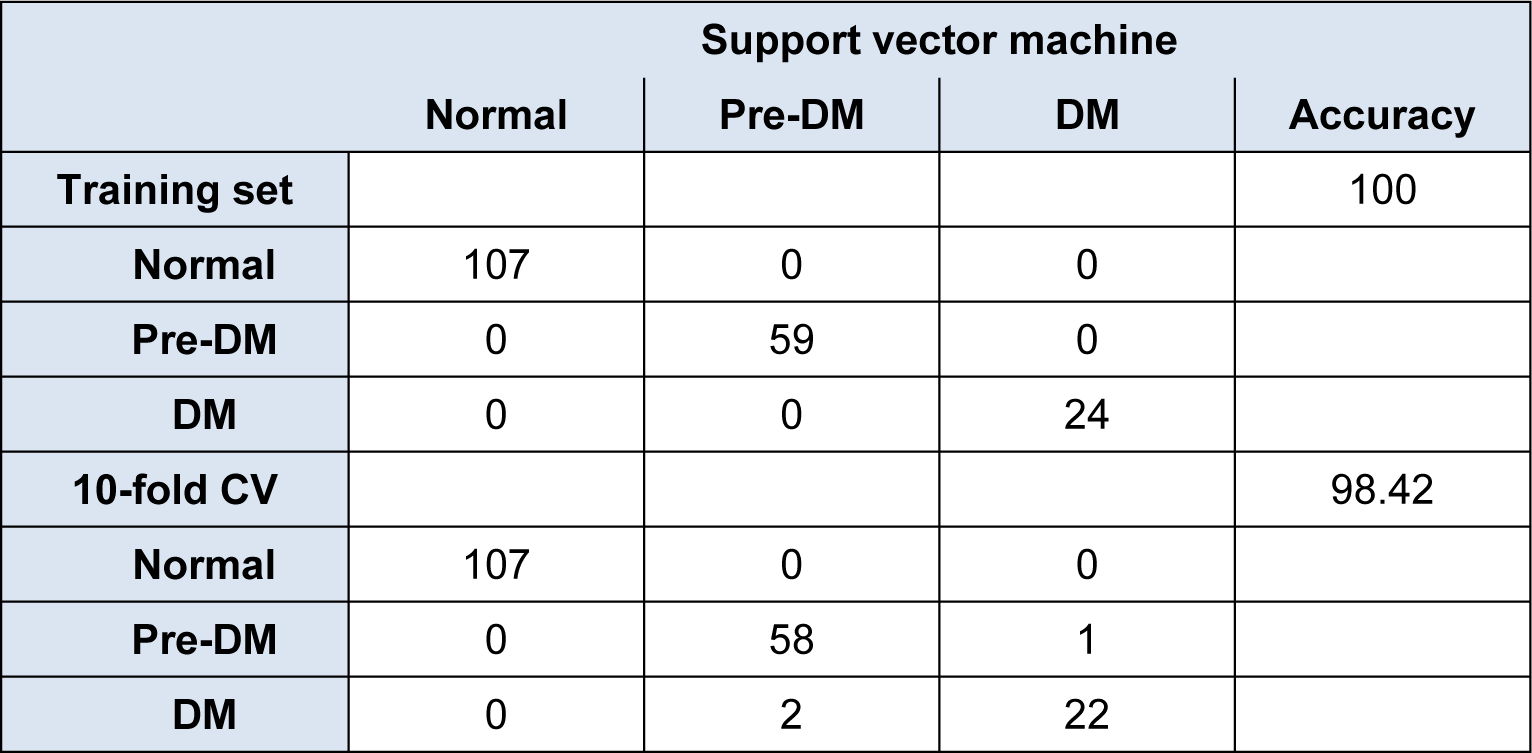
Table 3: Summary of predictive performance for diabetes mellitus identification using support vector machine
[*] Corresponding Author:
Chanin Nantasenamat, Center of Data Mining and Biomedical Informatics, Faculty of Medical Technology, Mahidol University, Bangkok 10700, Thailand; phone: +66 2 441 4371 ext. 2720, Fax: +66 2 441 4380, eMail: chanin.nan@mahidol.ac.th
